College of Engineering Unit:
Everybody has felt stressed at one point in their lives. It can be due to an impending dead- line,
or an unexpected event causing the stress. However, it is not always a straightforward process to
determine if a person is stressed and what may be causing it. This is the problem that this project
is aiming to solve.
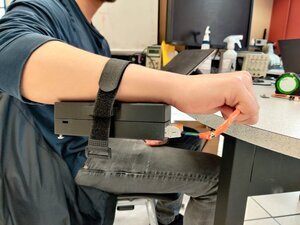
The objective of this project is to create a device capable of detecting stress in its user. The
wearable stress detection device will have 4 primary methods of determining if the user feels
stressed: galvanic skin response, heart rate, temperature, and a switch. The switch can be flipped
by the user if they feel stressed. All the sensors will be connected to a microcontroller housed in
an enclosure the size of a person’s wrist. The data collected by the microcontroller is then sent to
a website where the information is graphed and can be exported as a CSV. The project website shows the graphed data.
Engineering Requirements
-
The system will collect data from the sensors once every minute (2 second tolerance).
-
The data collected from the sensors cannot exceed certain degrees of tolerance based on sensor.
-
The enclosure for the whole system cannot exceed 2 inches.
-
The system must have a minimum battery life of 5 hours.
-
The system will send information wirelessly.
-
The system will shut down if no data is collected for five consecutive minutes.
-
The system should have a module that the user can interact with, to signify when they are feeling stressed. It should also display the input.
-
The system’s battery will be fully charged under 90 minutes.
Key Components
- Galvanic Skin Response (GSR) Sensor: responsible for measuring the resistance of the skin, two electrodes are attached to the user’s fingers.
- Heart Beat Sensor: responsible for measuring the user's heart rate. It is located at the bottom of the wrist.
- Temperature Sensor: responsible for measuring the user's temperature.
- Website: responsible for storing all the collected data from the sensors. The data is graphed for easy viewing and can be exported as a CSV file.
Project Website(s):