College of Engineering Unit:
This project analyzes a new Hewlett-Packard (HP) production process to determine utilization de-rates, or the material-time-in-system-constrained utilization, of tools. Utilization is the proportion of time a tool processes jobs, or the proportion of tool “up-time”.
When a system has variability in the time required to process jobs or the time between arrival of jobs, the time material spends in the process increases exponentially as utilization increases. Increased utilization decreases average tool availability, causing jobs arriving to the process to spend much more time in the process as part of a queue before processing. Limiting the build-up of jobs in the process, or work-in-process (WIP) inventory, has several benefits for process performance.
Utilization (except for in atypical, extreme cases) is directly proportional to the throughput of the process, or the rate the process can complete jobs. HP would like to maximize utilization while limiting WIP. Utilization de-rates are measures of utilization under the constraint of the average time material spends in the process, representing the maximum utilization a tool can operate at while maintaining an average time in system under a set limit. HP measures the average time jobs spend in a process relative to the average time a machine spends completing a job in the process - a metric known as the “x-intrinsic” value.
This project’s objective is to develop utilization de-rates for HP’s new panel production system by developing mathematical relations between machine utilization and x-intrinsic values for each of the 20 processes in the system. The project expands off of a 2019 Oregon state University Capstone project that had the same objective but used computer simulations of the processes to develop the de-rates, requiring the scope to be limited to processes with only one tool. In reality, many of the processes have multiple identical tools that can run simultaneously, significantly increasing the utilization de-rates of the system. This project expands on the 2019 project by using mathematical queueing models to efficiently develop utilization de-rates for each process for any number of tools. This project also includes sensitivity analysis to understand the variability of the de-rates as the values that affect the utilization de-rate vary themselves.
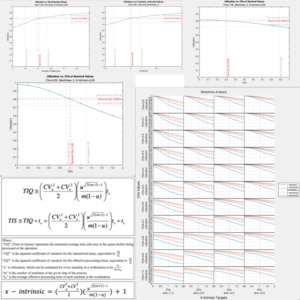
The team adapted Kingman’s Approximation, a mathematical queueing model for the average time a job spends in a process, to be relative to job processing time to develop an equation for x-intrinsic given utilization, number of machines, coefficient of variation of job processing time (CVe), and the coefficient of variation of time between arrival of jobs (CVa). HP provided the team operational data for each of the processes as well as the number of machines at each process. The team used sums of random variables and Monte Carlo simulations to estimate CVe for each process. Each process has exponentially-distributed time between arrival of jobs, so the CVa for each process is one by the nature of the exponential distribution. The project team applied these parameters to the derived x-intrinsic equation to relate x-intrinsic to utilization based on the operational characteristics of each process.
The project team additionally developed a MatLab script to automate this process for efficient calculations and sensitivity analysis. Given inputs of the typical range and nominal value for the number of machines, x-intrinsic limit, CVa, and CVe, the script performs single-variate and multivariate sensitivity analysis calculations and graphing. Single-variate analysis holds the three other input variable values constant at their nominal value and changes the value of the single input variable across its range, recording and graphing the corresponding utilization de-rate. Multivariate sensitivity analysis calculates de-rates for all possible combinations of values of the four input variables. This analysis informs HP which variables utilization de-rates are most sensitive to, identifying the variable that has the most influence to improve and increase the utilization de-rate and what the values of the input variables must be for the derived utilization value to hold close to true.
Industry Sponsor(s):
| Attachment | Size |
|---|---|
| 303.78 KB | |
| 329.09 KB |