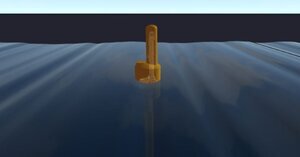
The Wave Energy Converter Visualization Software provides users with a 3D animation of a buoy device along with various graphs and charts based on real world data.
About
For this project, our team will be partnering with Max Ginsburg and Alex Hagmuller of Aquaharmonics with additional help from Chris Patton to deliver a clean and robust simulation of their wave energy device in action. This simulation should be able to take physical data recorded from the buoy and use it to reproduce the motion of the actual device within the simulation. Today, Aquaharmonics uses an older simulation called WEC-Sim that models a low-polygon version of their buoy and the forces acting on it, but they have identified some issues with this existing simulation and some features they would like to have added to make it a more useful tool that is also more visually appealing for investors. The current software to visualize buoy data is outdated and non informative. It is also rigid and difficult to customize for a user’s needs.
Goals and Components
The Data Visualization project is a web application that aims to expand a user’s ability to interact with their device data by allowing them to select different channels of data. Additionally, an updated rendering component is included using Babylon Js and WebGL shaders to simulate the wave field. The wave shader pulls equations from WEC-Sim to change the vertex coordinates to match the data. Additionally, it incorporates a sky box that emulates a realistic ocean environment. Normal and Reflection vectors are used in the fragment shader to create realistic lighting that includes ambient, diffuse, and specular. The data managing component provides the user with a way to customize their configurations and save them to Firebase. Firebase also acts as a measure of security by ensuring user authentication and appropriate access to data. Lastly, a buoy viewing component plots historical data from the NOAA website. The buoy view component also uses buoy metadata to plot the location of each buoy on a map component.